Geo-Eye
Department of Geography & GIS
Department of Geography & GIS
Geo-Eye
DOI: 10.53989/bu.ge.v15.i1.25.2 8
Year: 2026, Volume: 15, Issue: 1, Pages: 45-49
Original Article
S Santhosh1*
1Research Scholar, Department of Geology, Bangalore University, Bangalore, Karnataka, India
*Corresponding author
Email: [email protected]
Received Date:16 April 2026, Accepted Date:07 August 2026
Flash floods are characterized by their high speed and destructive power and rank among the most devastating natural phenomena, capable of inflicting extensive damage in a very short time. Often triggered by intense cloudbursts, these events cause significant property damage and human suffering. The increasing frequency of extreme hydrological events, such as cloudbursts during the monsoon season, particularly in Yelahanka, a suburb of Bangalore necessitates a detailed understanding of their hydro-morphometric drivers to effectively mitigate flood risks. Consequently, understanding the morphometric components in conjunction with meteorological events is crucial for effective water management and flood potential assessment. Therefore, a comprehensive hydro-morphometric analysis is indispensable for understanding the hydrological response of the basin to land cover changes due to rapid urbanization and extreme rainfall events. The present study incorporates advanced hydrological and morphometric modeling techniques, using remote sensing and GIS, to assess flood risk, thereby addressing the need for robust analytical frameworks in flood management. Such frameworks are critical for developing sustainable urban planning and infrastructure development strategies that account for the increasing threats posed by climate change-induced extreme weather events. The escalating frequency and intensity of rainstorm-induced flood disasters, exacerbated by climate change, highlight the urgent need for such detailed assessments to safeguard human survival and social development.
Keywords: Flood, Hydro-morphometry, Urbanization, Remote sensing and GIS, Climate change
Floods, one of the most damaging and prevalent natural hazards worldwide, have resulted in significant loss of both life and property globally, and the projected increase in frequency and intensity of these types of disasters will likely be due to global climate change[1]. Global vulnerability to flooding has increased due to urbanization and global climate change, although there is an increase in susceptibility in several regions of the world including the Asia-Pacific, Europe and North America[2]. Floods within Chinese cities have affected more than 180 cities per year since 2010 and resulted in economic losses directly related to flooding that have exceeded $14 billion USD[3]. Flash flooding in India has become a common occurrence throughout the summer monsoons, as well as subsequent effects on agricultural production, infrastructure, and human life[4]. Urban expansion and extreme precipitation have changed drainage patterns and flow accumulation, thereby influencing peak discharge rates[5]. Understanding the critical morphometric characteristics in combination with the effects of meteorological conditions is essential for effective water resource management and assessing potential for flooding in rapidly changing environments such as areas of high growth through urbanization and deforestation[6]. The use of advanced GIS (Geographic Information Systems) techniques along with remote sensing data define flood-prone areas and determine their susceptibility to flooding. These models are used to assess flood risk and to address the need for effective and robust analytical frameworks in flood management.
Aim and Objectives:
This research aims to understand the complex relationships of flood susceptibility within the rapidly developing urban area of Yelahanka in Bangalore, Karnataka. The rapid development of impervious land cover types that generate surface runoff due to increased conversion from agricultural lands and rangelands into built-up land covers has greatly increased runoff volumes, increased the rate of hydrologic events (i.e., hydrologic response time) and enhanced susceptibility to precipitation-driven flooding. Hydrologic and morphometric models were created using advanced technologies including remote sensing and geographic information systems (GIS). These models will be used for both modeling potential flood patterns and assessing the degree of vulnerability associated with these potential flood patterns, and to develop sustainable evidence-based solutions to mitigate current hydrologic imbalance issues and prevent future flooding.
Study Area:
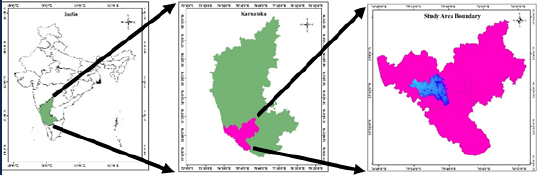
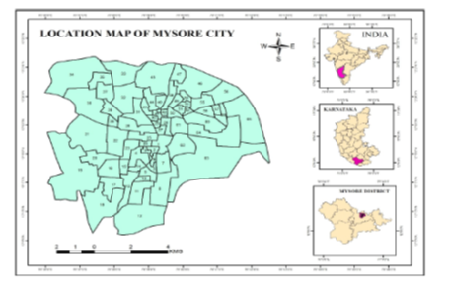
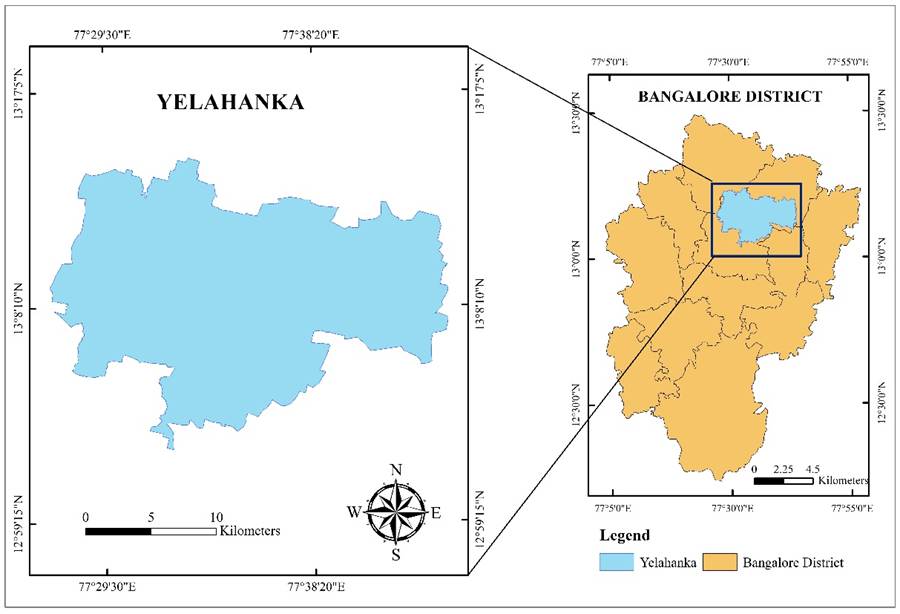
The study area Yelahanka constitutes a suburban area within Bangalore District, Karnataka. It forms a watershed within the Arkavathi river basin. The region experiences a semi-arid tropical climate, marked by moderate to hot temperatures that intensify evapotranspiration demands and constrain groundwater recharge. The terrain has undulating topography with elevations in Bangalore generally ranging up to 922 m MSL. This is dominated by erratic monsoon cloudbursts, rendering the area prone to flash flood risks.
Morphometric maps were generated using ArcGIS software, while meteorological graphs and plots were created using QGIS. Specifically, the slope map was derived from the ASTER Digital Elevation Model, the Land Use and Land Cover map from Sentinel-2 satellite data, and the flood inundation map from ALOS PALSAR elevation data. In addition, rainfall data downloaded from the India Meteorological Department was used to prepare the rainfall frequency distribution plots.
Slope Analysis:
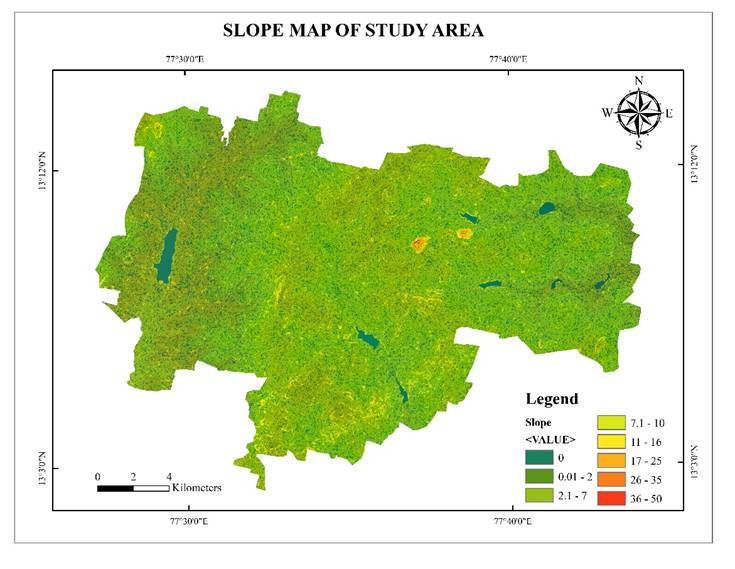
The slope map reveals an undulating terrain featuring transitional slopes where runoff accumulation intensifies [Fig. 2]. This spatial distribution compellingly demonstrates how micro-topographic variations dictate hydraulic responses in semi-urban landscapes. Conversely, gentler slopes facilitate greater infiltration and reduced runoff velocities, thereby mitigating flood potential in areas characterized by such topographic features[6]. In the study area, the low-lying surfaces are the most flood-susceptible and linked to lower elevations around 754 MSL. These sites are prone to stormwater pooling, local depressions, or abrupt slope breaks, which lead to rapid surface accumulation during intense rainfall events.
LULC Analysis:
The effects of LULC changes on hydrological processes can be investigated through hydrological modeling, statistical analysis, and comparative studies of experimental catchments[7]. The Land Use and Land Cover map of the study area reveals a landscape overwhelmingly dominated by built-up areas, agricultural lands, and rangelands, with only sparse tree cover and peripheral water bodies [Fig. 3].
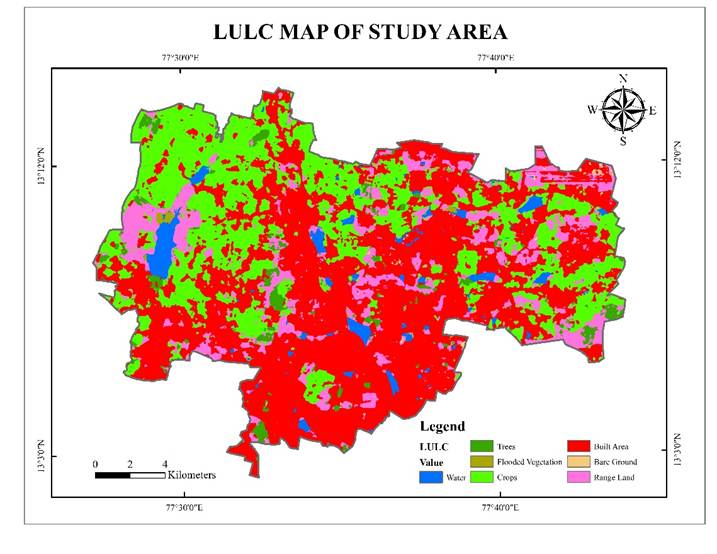
Hydrologically, the ubiquity of nearby built-up surfaces critically exacerbates surface runoff through heightened imperviousness, severely curtailing natural infiltration and thereby amplifying runoff volumes and accelerating response times during precipitation events[8]. In stark contrast, agricultural and rangeland patches serve as vital semi-permeable buffers, attenuating peak runoff and facilitating partial infiltration; these land uses exert a pivotal influence on the local hydrological regime by exhibiting moderate infiltration rates that enhance soil moisture retention and mitigate peak discharges under low- to medium-intensity rainfall[9]. However, their protective role diminishes under heavy precipitation, where compacted soils and sparse vegetation generate substantial runoff[10]. Complementing this, dispersed tree-covered areas provide essential interception losses and bolstered infiltration, acting as indispensable natural buffers that decelerate overland flow and promote groundwater recharge counterbalancing the flood risks posed by impervious expansion[11].
Flood Inundation Analysis:
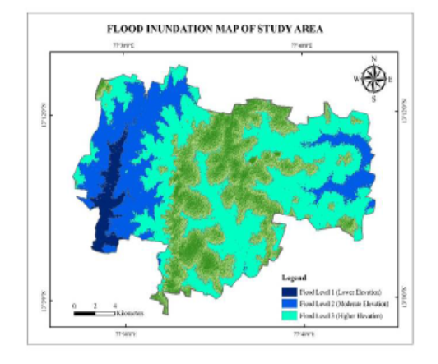
The flood inundation map depicts spatial variations in flood susceptibility across the study area under modeled rainfall and runoff conditions [Fig. 4].
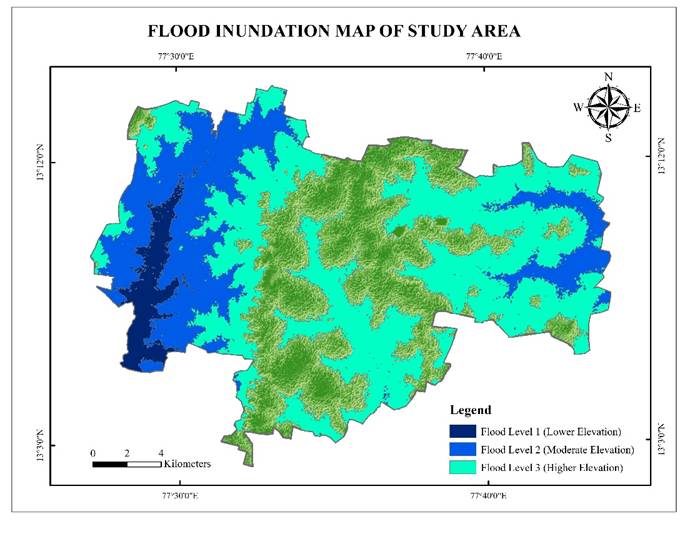
The inundation model comprises three classes: low (level 1), moderate (level 2), and high (level 3), reflecting differences in surface elevation, slope, and proximity to drainage pathways[12]. Hydrologically, level 1 zones correspond to low-lying terrain and natural drainage confluences where runoff accumulates, while level 2 zones serve as temporary storage during peak rainfall retarding downstream flow but increasing water depth. In contrast, level 3 zones represent transitional areas through which surface runoff passes without stagnating for extended periods. Overall, the map indicates manageable flood risk, provided development aligns with natural flow paths and preserves downstream hydrological function.
Meteorological Data Processing and Analysis:
The meteorological data, recorded in centimeters, were obtained from the National Data Centre of Bangalore, India, for the period 2000–2024. These data were subjected to frequency analysis methods, such as the Gumbel distribution, with results recorded accordingly [Table. 1].
| Parameter | Value |
|---|---|
| Catchment Area (km²) | 394.98 |
| Curve Number | 85 |
| Manning's n | 0.05 |
| Time to Peak (hr) | 5.56 |
| Mean Slope (%) | 6.89 |
| Rainfall Source | IMD |
| Frequency Method | Gumbel |
| Runoff Method | SCS-CN |
| Rainfall Duration (hr) | 24 |
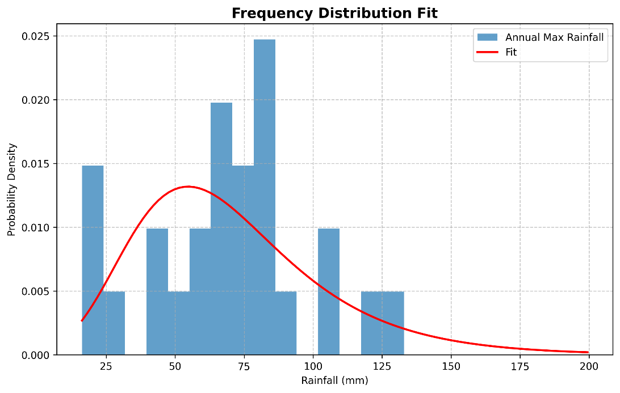
This approach provides the most robust estimates of design rainfall for various return periods, which is critical for planning hydraulic structures and mitigating flood risks[13]. The frequency distribution fit graph depicts the probabilistic variation in annual maximum rainfall data from the study area [Fig. 5]. Specifically, the histogram shows the frequency of various rainfall magnitudes, with the highest concentration of events between 100 mm and 125 mm, indicating that most rainfall in this region falls into moderate to high-intensity categories. These values are characteristic of the southwest monsoon season, which dominates the area's hydrological cycle. Its positively skewed nature reveals that, while most events are moderate, the region occasionally experiences extreme episodes far exceeding the average. Consequently, such extremes that exceed 60 mm in 24 hours, can generate high surface runoff, temporary flooding, and elevated discharge rates within the watershed, particularly amid steep topography and limited infiltration zones. This aligns with findings from other monsoon-dominated regions, where rapidly increasing, high-intensity rainfall events are observed[14]. Ultimately, this analysis highlights the need to adopt adaptive hydrological infrastructure, such as pervious pavements, detention basins, and rainwater harvesting systems, to manage excess runoff from extreme precipitation events while enhancing groundwater recharge in the region.
The hydro-morphometric analysis reveals the critical transitional slopes and high-risk low-lying areas at ~754 MSL. In these vulnerable low-lying areas, retention and detention basins should be constructed to temporarily store excess runoff during intense monsoon rainfall, thereby substantially reducing downstream flooding risks. Complementing these structural measures, rainwater harvesting pits and recharge wells should be installed to capture roof and surface runoff, promoting aquifer replenishment and alleviating stormwater loads exacerbated by land cover changes. To safeguard built-up zones, green buffer zones must be designated along drainage lines and watercourses, accommodating overflow as micro-topographic depressions. Technological interventions, such as real-time rainfall and runoff monitoring sensors coupled with GIS-based flood alert systems, should also be introduced for proactive flood management. Finally, community awareness campaigns on flood preparedness, waste control, and drainage maintenance are essential for sustained efficacy.
I am grateful to the USGS for supplying the digital datasets that substantially supported the geospatial analyses. Likewise, I thank the India Meteorological Department, Ministry of Earth Sciences, Government of India for providing rainfall data that are readily accessible for download and research applications.
1. Shamsudduha M. Redefining flood hazard and addressing emerging risks in an era of extremes. npj Natural Hazards. 2025; 2 (1). Available from: https://doi.org/10.1038/s44304-025-00082-7
2. Hemmati M, Mahmoud H, Ellingwood BR, Crooks A. Unraveling the complexity of human behavior and urbanization on community vulnerability to floods. Scientific Reports. 2021; 11 (1). Available from: https://doi.org/10.1038/s41598-021-99587-0
3. Tian J, Chen Y, Yang L, Li D, Liu L, Li J, et al. Enhancing Urban Flood Susceptibility Assessment by Capturing the Features of the Urban Environment. Remote Sensing. 2025; 17 (8). Available from: https://doi.org/10.3390/rs17081347
4. Nandana Dilip K, Vegad U, Mishra V. Drivers of flash floods in the Indian sub-continental river basins. npj Natural Hazards. 2025; 2 (1). Available from: https://doi.org/10.1038/s44304-025-00121-3
5. Jato‐Espino D, Sillanpää N, Charlesworth SM, Rodríguez-Hernández J. A simulation-optimization methodology to model urban catchments under non-stationary extreme rainfall events. Environmental Modelling & Software. 2019; 122 Available from: https://doi.org/10.1016/j.envsoft.2017.05.008
6. Lalhmingliana, Rao Ch. UB, Saha G. Computational water management strategy of Tlawng River Basin using geo-informatics. Environmental Engineering Research. 2019; 25 (5). Available from: https://doi.org/10.4491/eer.2019.251
7. Birhanu A, Masih I, van der Zaag P, Nyssen J, Cai X. Impacts of land use and land cover changes on hydrology of the Gumara catchment, Ethiopia. Physics and Chemistry of the Earth, Parts A/B/C. 2019; 112 Available from: https://doi.org/10.1016/j.pce.2019.01.006
8. Xu C, Rahman MA, Haase D, Wu Y, Su M, Pauleit S. Surface runoff in urban areas: The role of residential cover and urban growth form. Journal of Cleaner Production. 2020; 262 Available from: https://doi.org/10.1016/j.jclepro.2020.121421
9. Nagy G, Lóczy D, Czigány S, Pirkhoffer E, Fábián SÁ, Ciglič R, et al. Soil moisture retention on slopes under different agricultural land uses in hilly regions of Southern Transdanubia. Hungarian Geographical Bulletin. 2020; 69 (3). Available from: https://doi.org/10.15201/hungeobull.69.3.3
10. Emmerich WE, Heitschmidt RK. Drought and Grazing: II. Effects on Runoff and Water Quality. Journal of Range Management. 2002; 55 (3). Available from: https://doi.org/10.2307/4003128
11. Larbi I, Obuobie E, Verhoef A, Jülich S, Feger KH, Bossa AY, et al. Water balance components estimation under scenarios of land cover change in the Vea catchment, West Africa. Hydrological Sciences Journal. 2020; 65 (13). Available from: https://doi.org/10.1080/02626667.2020.1802467
12. Teng J, Jakeman AJ, Vaze J, Croke BFW, Dutta D, Kim S. Flood inundation modelling: A review of methods, recent advances and uncertainty analysis. Environmental Modelling & Software. 2017; 90 Available from: https://doi.org/10.1016/j.envsoft.2017.01.006
13. Gupta SK, Dalal S, Babu R. Frequency Analysis of Rainfall Data. Indian Forester. 1968; 94 (5). Available from: http://www.i-scholar.in/index.php/indianforester/article/view/25878
14. Jayanti M, Marganingrum D, Santoso HA, Qadafi M, Mariana M, Ariesyady HD, et al. Using Rainfall Characteristics for Sustainable Water Resources Management in Monsoon Climate Zone. 2024; Available from: https://doi.org/10.2139/ssrn.4949163
© 2026 Santhosh. This is an open-access article distributed under the terms of the Creative Commons Attribution License, which permits unrestricted use, distribution, and reproduction in any medium, provided the original author and source are credited.
Published By Bangalore University, Bengaluru, Karnataka
Subscribe now for latest articles and news.